nv_es
novelibre ${Home page} > Páginas en castellano > ${Online help} > ${Plot lines} menu
${Plot lines} menu
Plot line elements operation
${Add Plot line}
Add a new plot line to the story
With ${Plot lines} > ${Add Plot line}, you can add a plot line to the tree.
- If a plot line is selected, the new plot line is placed after the selected one.
- Otherwise, the new plot line is placed at the last position.
- The new plot line has an auto-generated title. You can change it in the right pane.
${Add Plot point}
Add a new Plot point to the selected plot line
With ${Plot lines} > ${Add Plot point}, you can add a plot point to a plot line.
- If a plot point is selected, the new plot point is placed after the selected one.
- If a plot line is selected, the new plot point is placed at the last position.
- Otherwise, no new plot point is generated.
- The new plot point has an auto-generated title. You can change it in the right pane.
${Assign color…}
Assign a color to all selected plot lines
With ${Plot lines} > ${Assign color…} you can assign a color to all plot lines in a single or multiple selection. A color picker dialog opens. If you cancel the color choosing process, the color of the selected plot lines remain unchanged.
${Reset color}
Reset the colors of all selected plot lines
With ${Plot lines} > ${Reset color} you can clear the color assignments for all plot lines in a single or multiple selection.
${Import plot lines}
Import plot lines with plot points from another project
With ${Plot lines} > ${Import plot lines}, you can import a selection of plot lines from another project. First you select an XML file containing the plot lines. Then you select the plot lines you want to add to the current project.
Hint
To create an XML plot lines file for the current project, use ${Export} > ${XML data files}.
${Export plot grid for editing}
Export an ODS document that can be imported again after editing
With ${Plot lines} > ${Export plot grid for editing}, you can create a spreadsheet with a row per section, containing the following data:
- The sequential section number as a hyperlink to the section in the manuscript (if any)
- Story date
- Story time
- Day
- Duration (<days>d <hours>h <minutes>min)
- Section title
- Section description
- Viewpoint character
- One column per plot line with the section’s plot line notes
- Tags
- Scene
- Goal/Reaction/(custom)
- Conflict/Dilemma/(custom)
- Outcome/Decision/(custom)
- Section notes
The plot line titles are linked to the plot line descriptions (see below).
Note
Only “normal” sections appear in the plot grid. Sections of the “${Unused}” type are omitted.
The document can be edited with Calc and reimported. File name suffix
is _grid_tmp.
- Clicking on a section number with
${Ctrl}pressed, you can jump to the corresponding section in the manuscript. - Clicking on a plot line title in the headline with
${Ctrl}pressed, you can jump to the corresponding plot line description, if any (see below).
Note
You can reorder, hide or delete columns and rows without affecting the reimport. Only the first column and the first row, which are hidden by default, must not be changed as they contain the structural information for the import.
${Export plot line descriptions for editing}
Export an ODT document that can be imported again after editing
With ${Plot lines} > ${Export plot line descriptions for editing},
you can create a text document that contains stages, plot lines, and
plot points, each with description. The plot points are linked to the
manuscript and to the section descriptions. File name suffix is
_plotlines_tmp.
${Plot table (export only)}
Export an ODS document
With ${Plot lines} > ${Plot table (export only)}, you can create a spreadsheet
with a row per section and a column per plot line. Associations between
plot lines and sections are color-highlighted. Plot point titles are
displayed. File name suffix is _plotlist.
Hint
The plot line titles and the section titles are hyperlinked to the respective descriptions in other exported documents, if any.
The following picture shows a LibreOffice screenshot. Note the hyperlink from the plot line title in the plot table (left) to the plot line in the plot description (right).
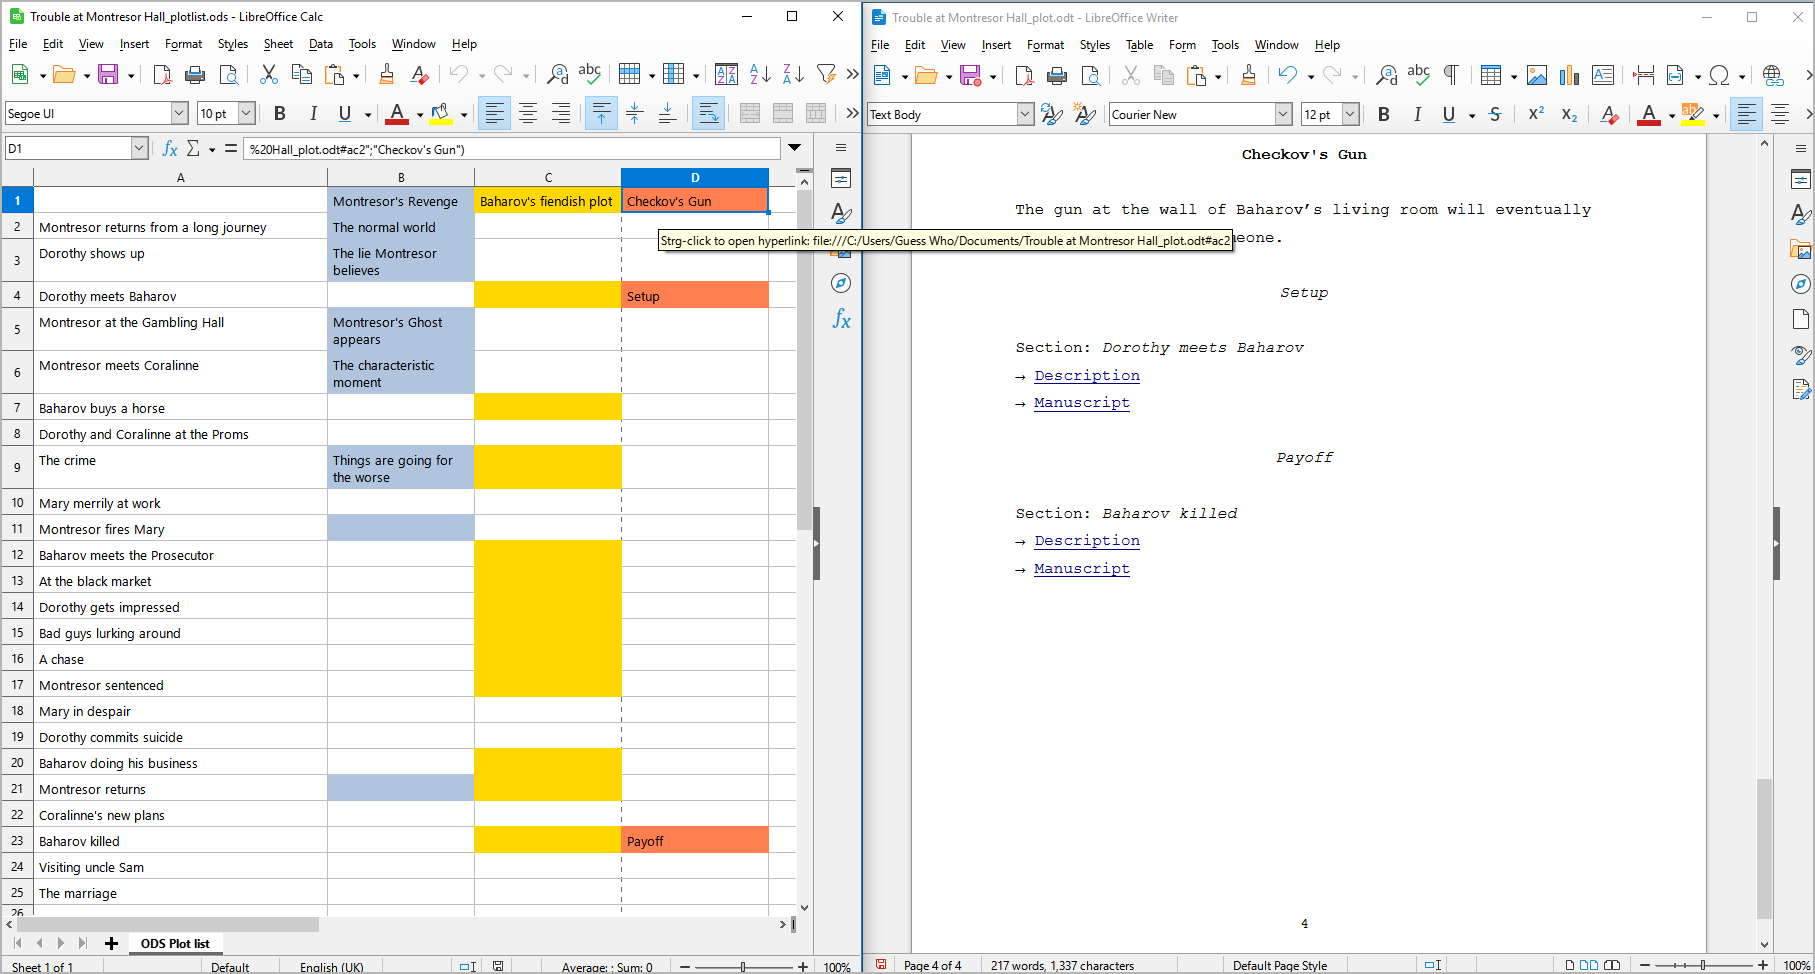
Important
Hyperlinks in ODS spreadsheets are absolute within the file system, so they might not work after moving the location of your project file to another folder or computer. In this case, you will have to export the spreadsheet anew.
${Show Plot table in browser}
Show an HTML report with plot elements
With ${Plot lines} > ${Show Plot table in browser}, You can create a HTML file that contains a plot table similar to the ODS plot table (see above), but without any hyperlinks, and launch your system’s web browser for displaying it.

Note
The report is a temporary file, auto-deleted on program exit. If needed, you can have your web browser save or print it.
${Show Plot line board in browser}
Show an HTML report with plot point cards arranged by plot lines
With ${Plot lines} > ${Show Plot line board in browser}, You can create a HTML file that contains a board with “index cards” for all plot lines and plot points. The index cards contain the title and the description of the corresponding element. The plot line cards are arranged in the first column. Each plot line card opens a row containing the cards of the assigned plot points.
Note
The report is a temporary file, auto-deleted on program exit. If needed, you can have your web browser save or print it.
Copyright (c) by Peter Triesberger. All rights reserved.